


Sometimes clarity doesn’t come from long explanations.
It comes from a single visual shift.
Imagine two graphs.
The first shows rising property prices.
The second shows maintenance costs, redesign frequency, and service replacements over the same timeline.
Suddenly, what looked like growth now looks like complexity.
Most people make decisions based on the first graph — the visible metric.
Few pause to explore the second — the invisible ecosystem cost.
And yet, both together tell the real story.
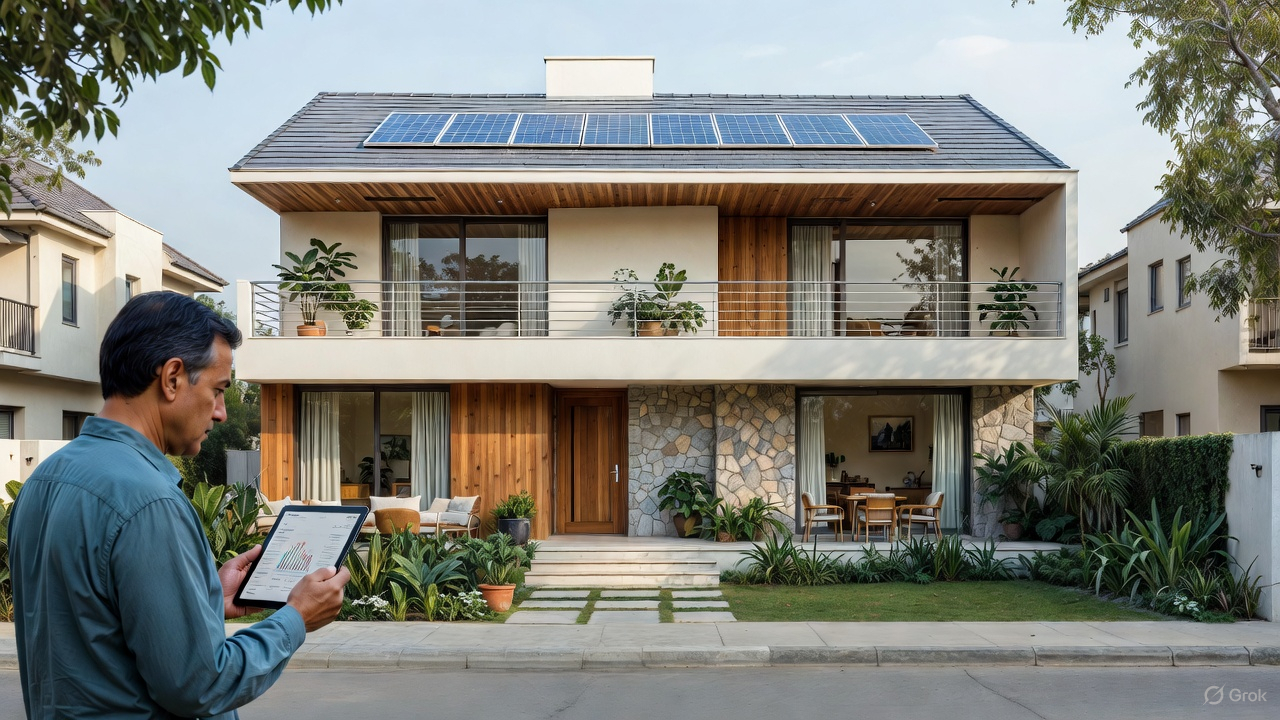
Whether planning a home or a commercial space, decisions are rarely influenced by one factor alone. Furniture durability affects redesign cycles. Plumbing choices affect repair frequency. Builder coordination affects long-term efficiency. When viewed individually, each decision seems minor. When viewed together, they shape the entire lifecycle of a space.
Modern digital ecosystems and planning apps are beginning to make these “second graphs” more visible. Instead of offering isolated inspiration, they reveal interconnections — allowing individuals to evaluate decisions with layered awareness rather than surface appeal.
Perspective changes when information is structured visually and contextually.
A single graph may inform.
A connected ecosystem enlightens.
sometimes the smartest insight is not more data — it is better framing.